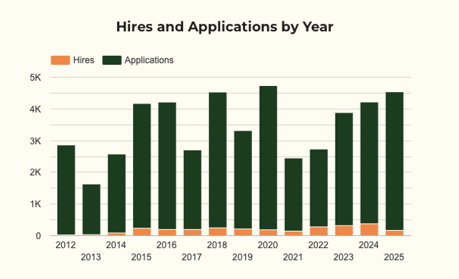
Hiring Dashboards in Action
June 25, 2026
Read article


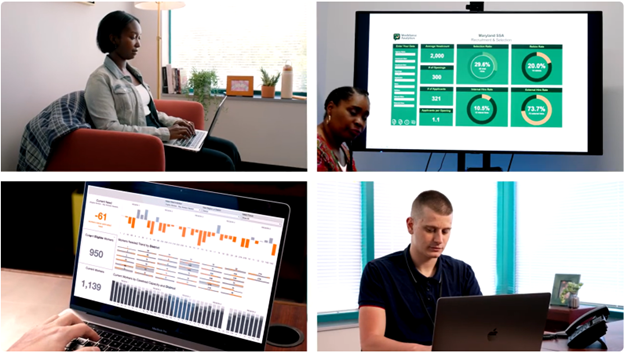
What Workforce Analytics Look Like in Child Welfare Agencies
June 23, 2026
Watch video
Announcing our NEW AI-integrated Workforce Analytics App to help you do more with your workforce data
June 18, 2026
View tool
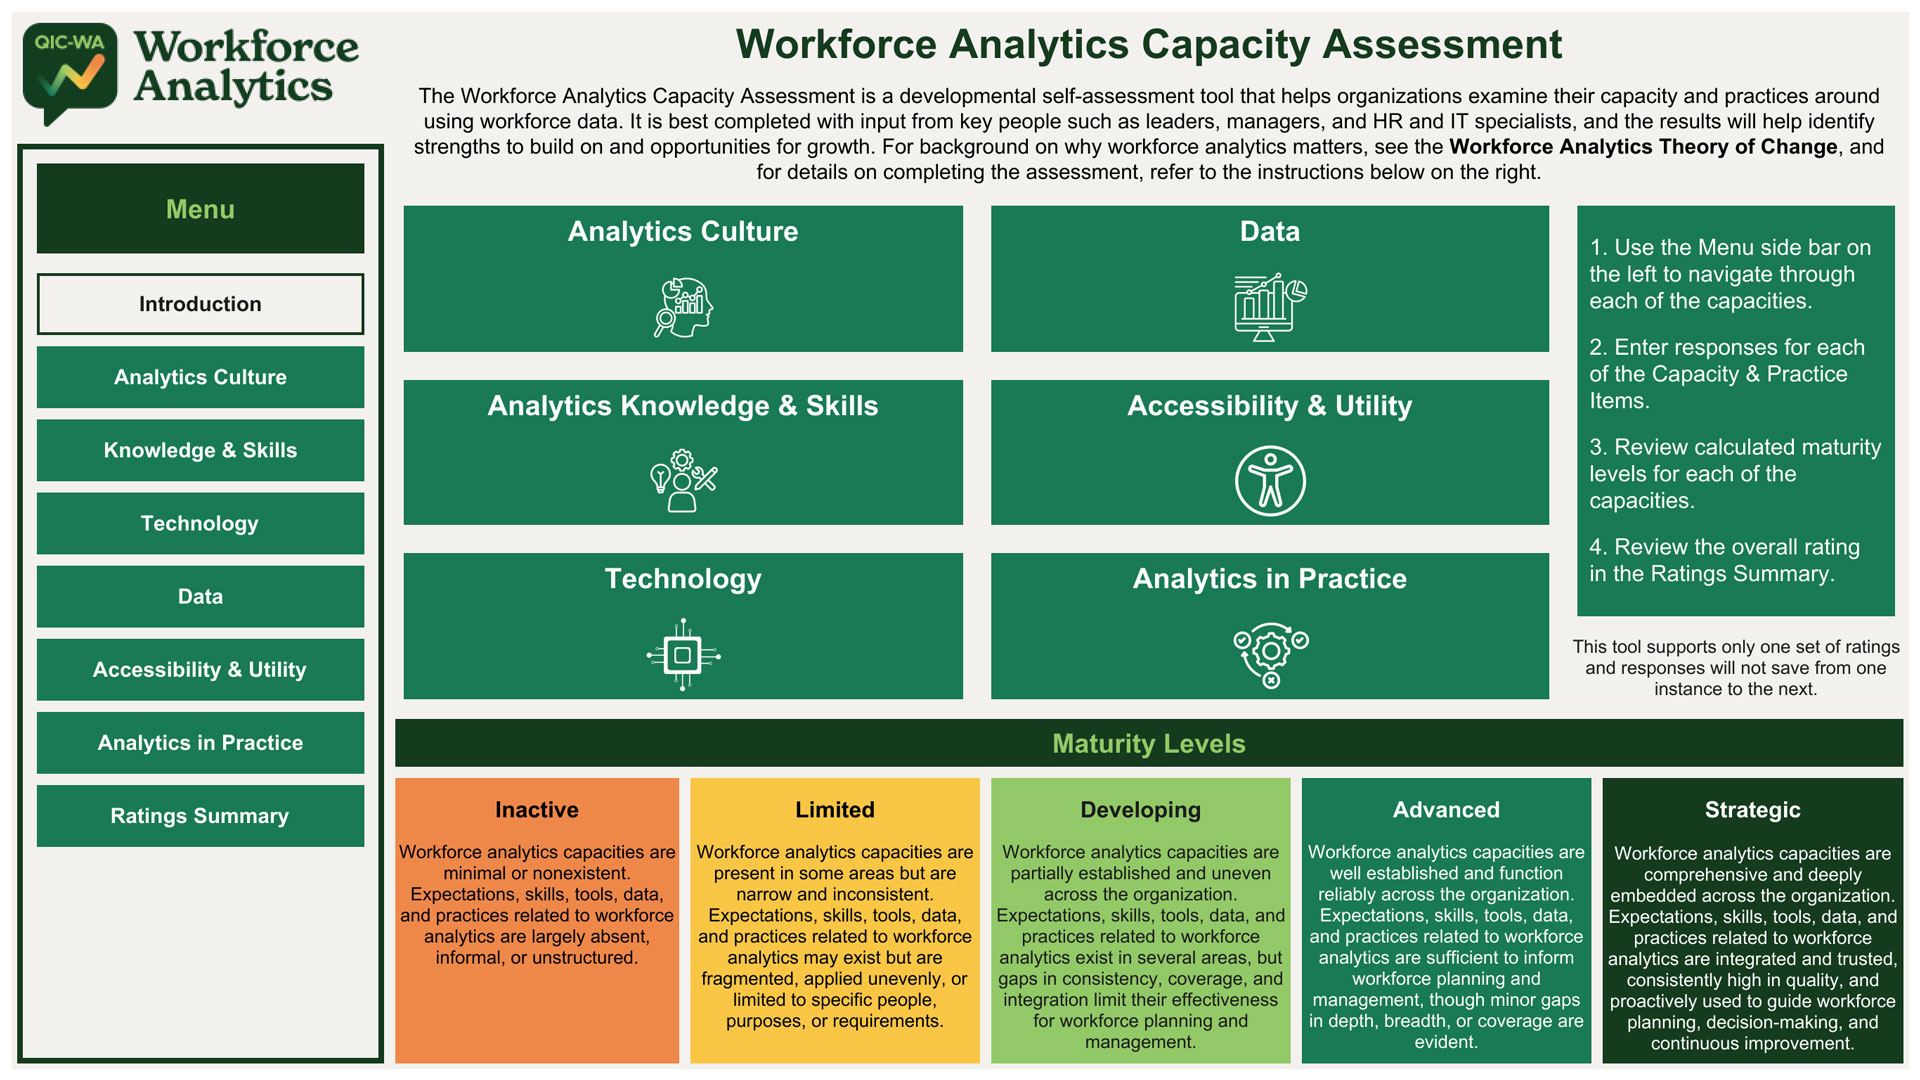
Workforce Analytics Capacity Assessment
June 8, 2026
View tool

Illuminating Pathways
April 24, 2026
View tool
Workforce Conversation Guides
April 13, 2026
View tool
.jpg)
Learning from Tribal Workforce Efforts
March 6, 2026
Read article
Strengthen Your Child Welfare Agency with Data
March 6, 2026
Watch video

Using Data to Strengthen Tribal Child Welfare Systems
March 6, 2026
Watch video

Why a Quality Improvement Center focused on Workforce Analytics?
March 6, 2026
Read article

Why Develop a Data Dashboard?
March 6, 2026
Watch video